Nikkei 225 and Hang Seng indices rally explained: what next?

Asian stock indices continued their uptrend, mirroring the ongoing bull run in Wall Street. Japan’s Nikkei 225 jumped to ¥58,350, its highest level since February 28 and 15% above its lowest level this year. Similarly, Hong Kong’s Hang Seng Index has jumped to $26,100.
Why Hang Seng and Nikkei 225 indices are rising
The two indices are mirroring the performance of their global peers. For example, the blue-chip Dow Jones and Nasdaq 100 indices soared by over 300 and 450 points, respectively, on Tuesday and are nearing their all-time highs.
This stock market surge is happening in a week that should be bearish for equities. For one, talks between the US and Iran failed during the weekend pushing Donald Trump to launch a blockade of all ships moving from Iranian ports.
This naval blockade is aimed at preventing Iran’s control of the Strait and depriving Tehran of financial resources. As such, in theory, the blockade would have led to lower stocks and higher crude oil prices.
In reality, stocks jumped, and crude oil prices tumbled by double digits as investors predicted that the two sides would talk again. Brent and the West Texas Intermediate benchmarks have plunged to $95 and $92, respectively.
Rumors are that the two sides will meet on Thursday or any day before the ceasefire ends. There are also chances that Trump will extend the ceasefire date now that the stock market is rising, as he likes.
Asian indices like the Nikkei 225, Topix, Kospi, and Hang Seng are rising because these countries will benefit when the war ends. The region, together with Europe, are among the most affected by the war because of the vast amount of natural gas and crude oil it imports from Asia.
The optimism of the war is fueling a risk-on sentiment among investors. This also explains why the crypto market is also soaring, with Bitcoin rising above $74,000.
Hang Seng Index technical analysis
The daily chart shows that the HSI Index bottomed at $24,225 on March 23rd. It then rebounded to the current $26,190 as the risk-on sentiment continued.
The token formed an inverted head-and-shoulders pattern, a popular bullish reversal sign in technical analysis. It has remained solidly above the 50-day and 100-day moving averages.
The Hang Seng Index has also jumped above the 23.6% Fibonacci Retracement level. At the same time, the Relative Strength Index (RSI) has jumped to its highest level since February 11. The two lines of the Percentage Price Oscillator (PPO) have made a bullish crossover.
Therefore, the index will likely continue rising as bulls target the year-to-date high of $27,960, which is about 6.65% above the current level.
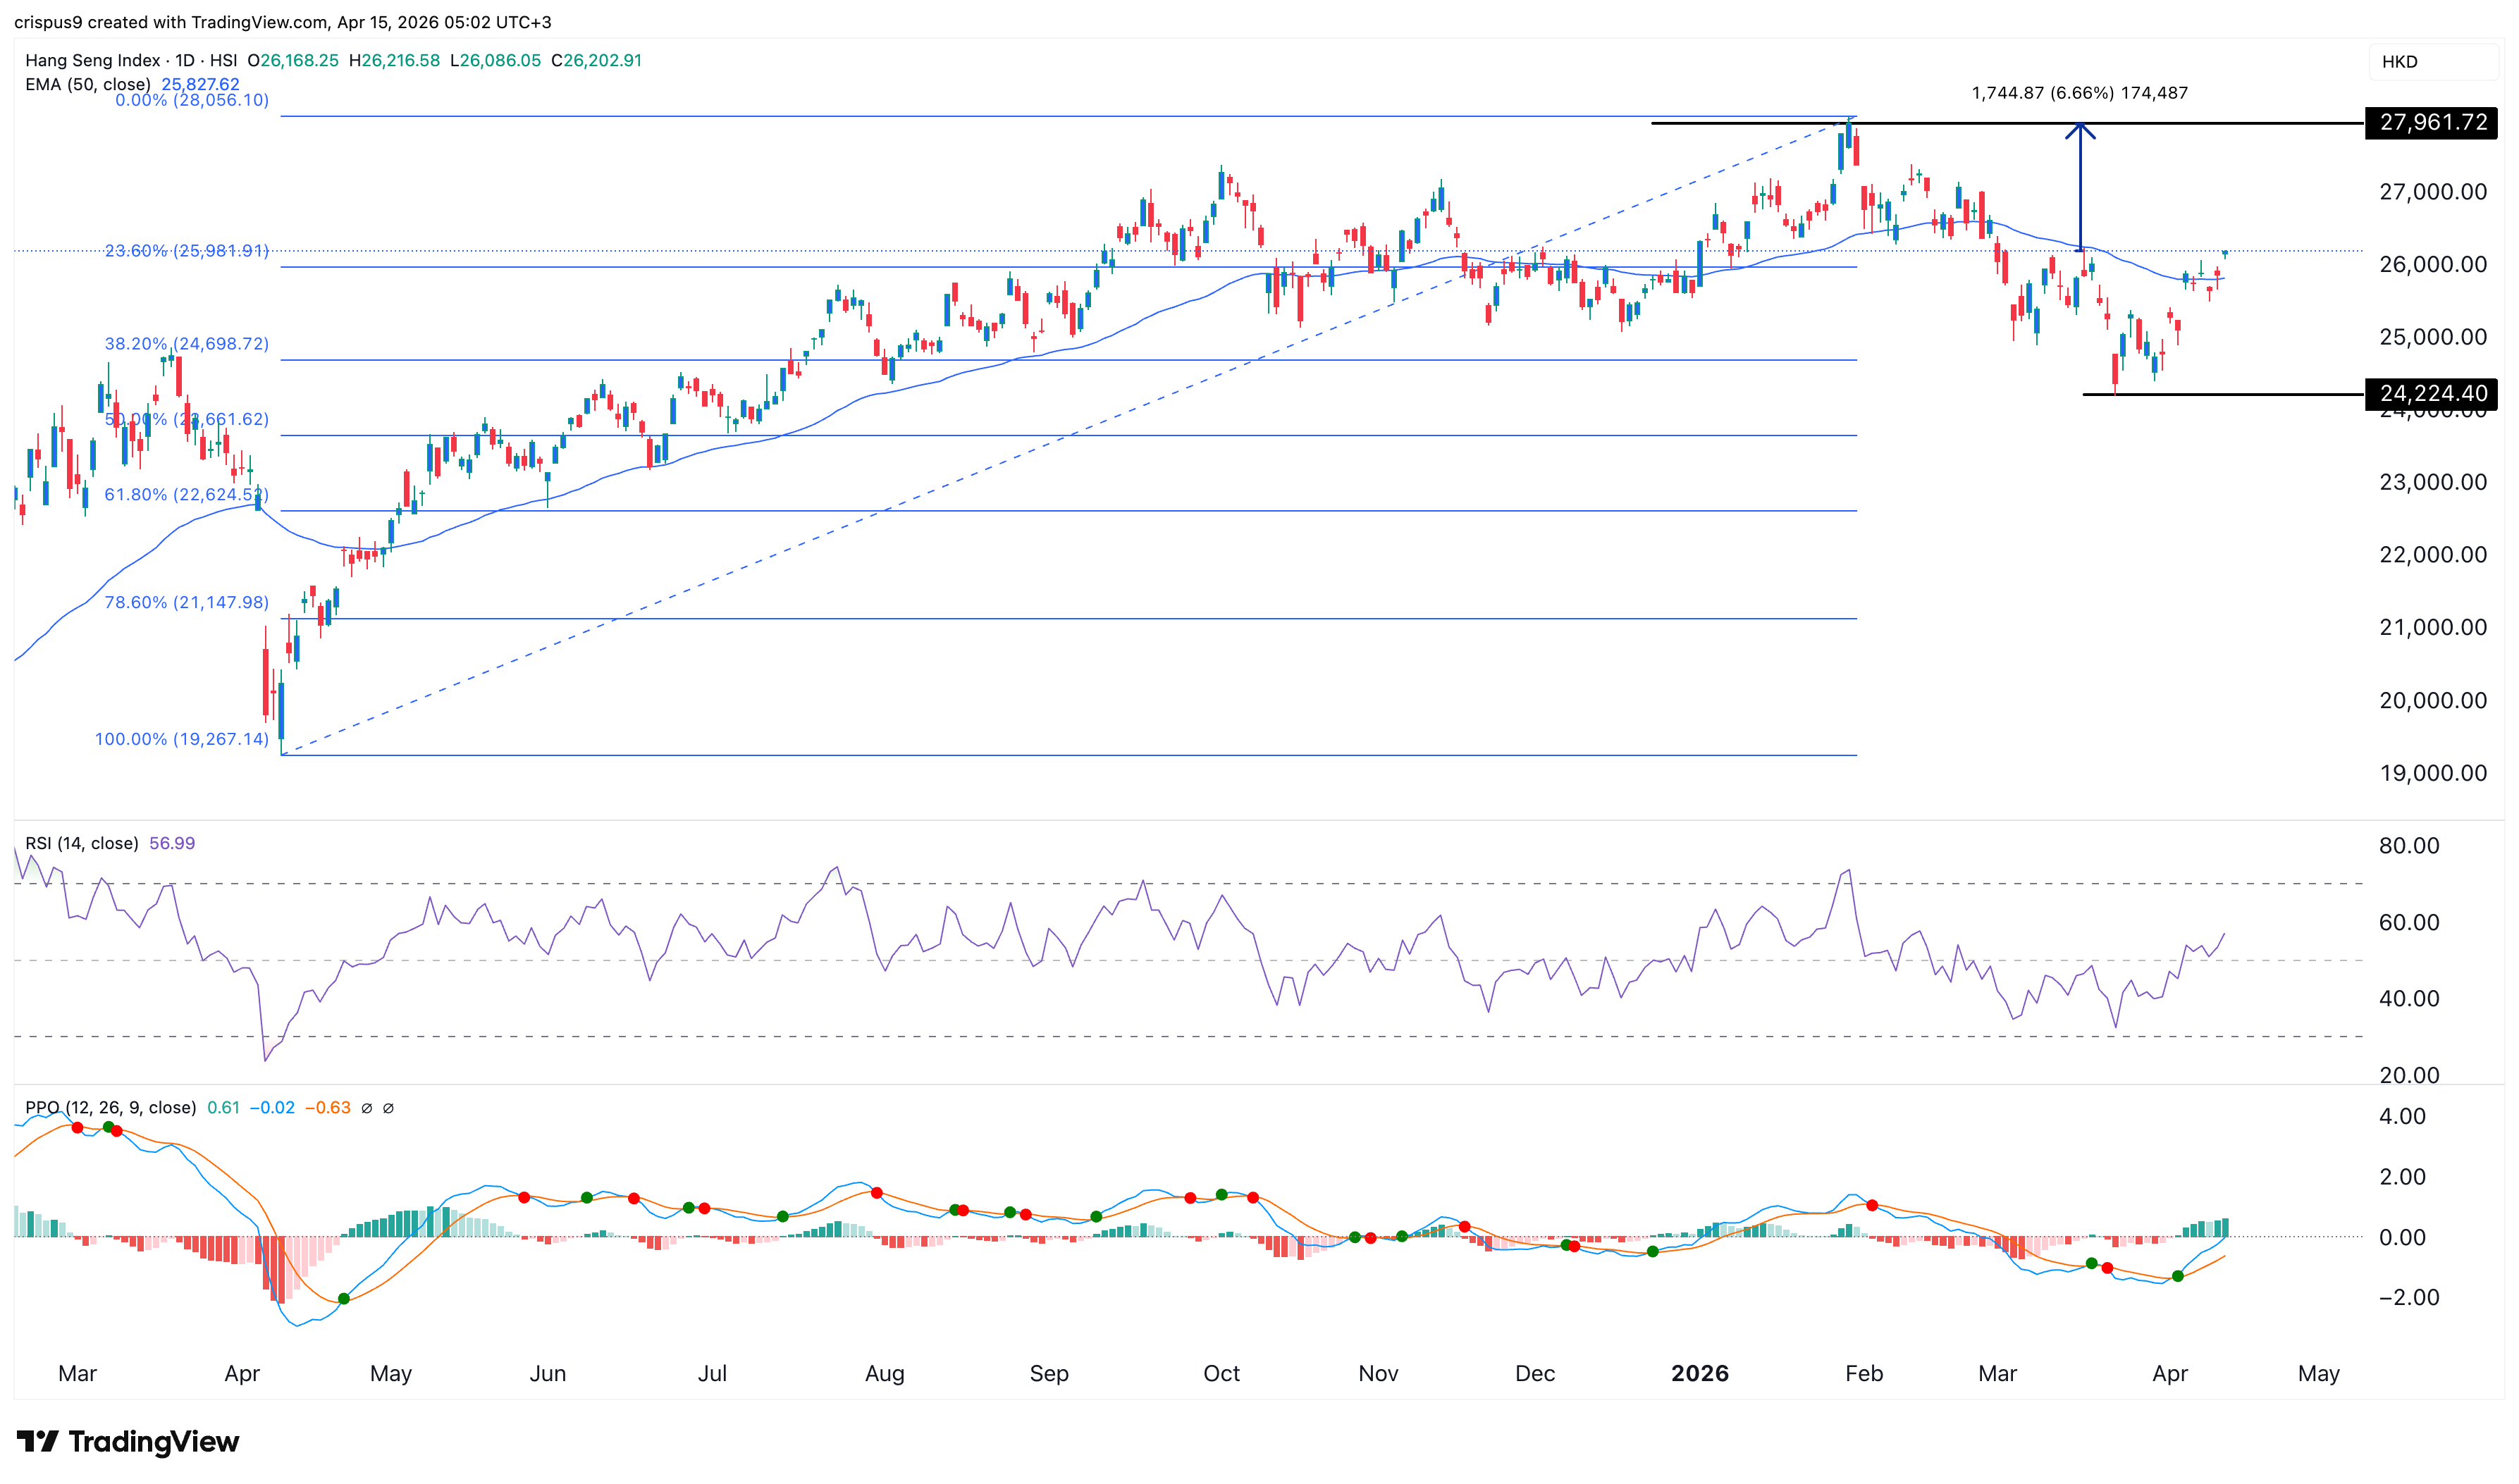
HSI price chart | Source: TradingView
Nikkei 225 Index technical analysis
The daily timeframe chart shows that the Nikkei Index has rebounded and is moving close to the all-time high. Like the Hang Seng, it has already flipped the 50-day moving average into a support level.
The Relative Strength Index and the MACD indicators have continued rising a sign that the bullish momentum is continuing.
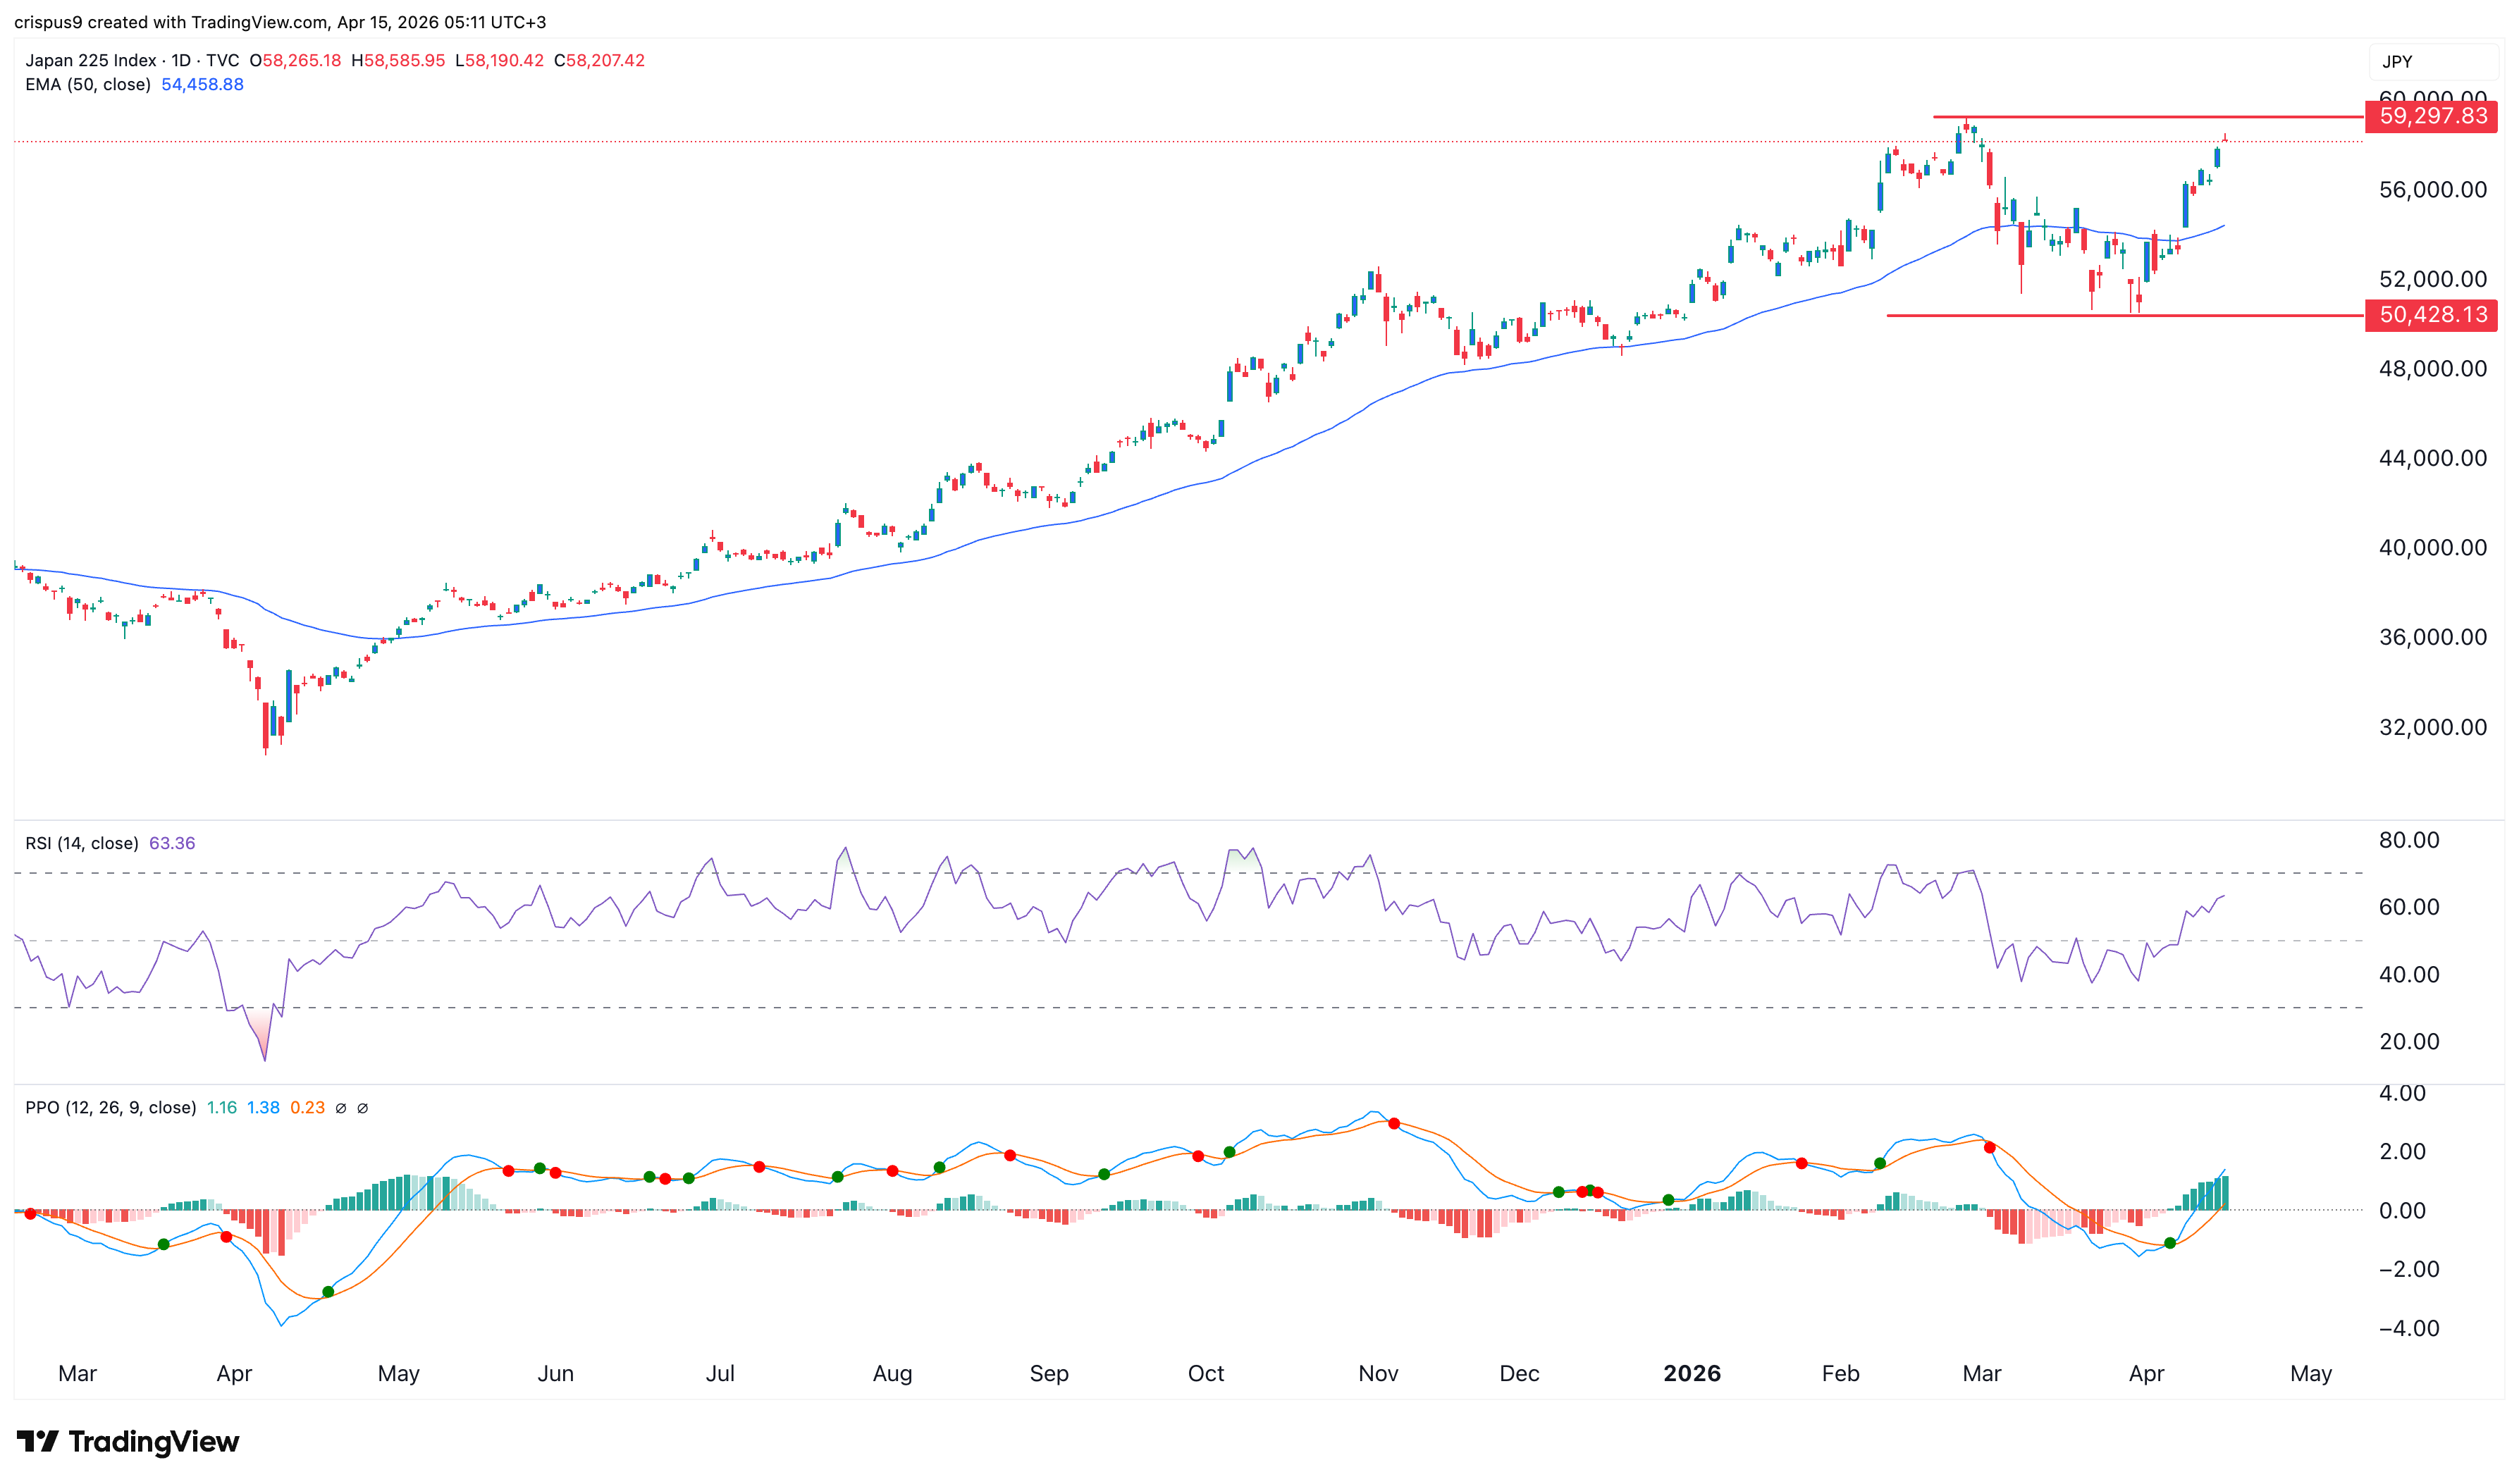
Nikkei 225 chart | Source: TradingView
Therefore, the index will continue rising as bulls target the all-time high of 59,297. A move above that level will point to more gains to the psychological level at 60,000.
The post Nikkei 225 and Hang Seng indices rally explained: what next? appeared first on Invezz